Compose Collection
Module Description Version 4.7
The main advantage of Compose Collection is that the user will be able to fully utilize Netcool Operation Insight (NOI) with only a few hours of training on the modules in Compose Collection.
Background
With our long experience gained by working with Netcool in our customers environments we have learnt what is needed to get a good start and in an efficient manner get most value out of the technology as well as the organization. We have gathered over 600 000 hours experience and are always searching for smarter ways to create value in our customers environments.
The main advantages with Compose Collection together with Netcool are:
- Fast implementation
We have made a predefined data model that is suitable for all customer’s needs. This means that a lot of functionality is in place immediately and fast. It also speeds up the implementation project significantly.
- Easy to manage
User friendly graphical interfaces let you configure the event behaviour without complex coding.
- Flexibility
The flexibility is enormous. It is easy to adapt each customers system to their own needs.
- Easy to visualize based on individual needs
Each manager, department or DevOps team can have their own dashboards, reports and set of rules.
Modules
Dynamic Event Management (DEM)
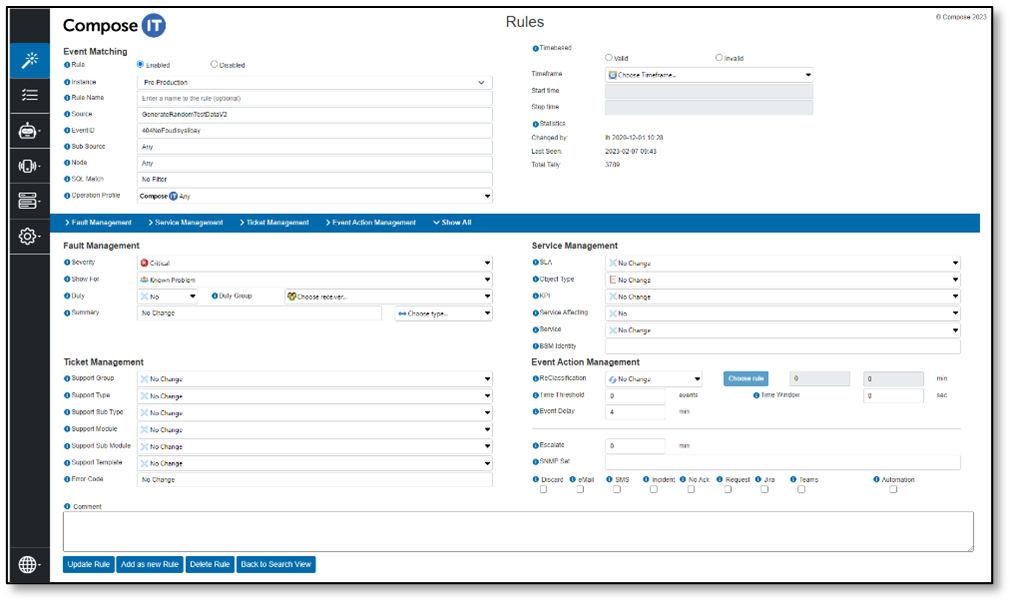
Dynamic Event Management is an application that includes both a user-friendly GUI, a rule- and automation engine as well as a predefined data model with associated triggers.
The solution has been built based on our knowledge and together with our customers during the years we have been working as Netcool consultants.
In a traditional Netcool implementation a lot of work must be done in the probe rule files and to get all information and logic to each event a lot of coding must be done.
Dynamic Event Management takes that part away and add a lot of new functionalities too.
One of our philosophies has always been: “You should not show something for someone that you don’t expect someone to do anything about”.
- Predefined Data model and triggers
- Event Matching with single or combinations of keys and timeframes
- GUI based Event Classification
- Show For logic – Only show events that you expect someone to take care of
- Event Enrichment – Severity, ObjectType, Service Affecting, KPI etc.
- Ticket Routing in ITSM system
- Event Actions – Mail, SMS, Ticket, Chat, Delay, Escalation, Discard, Expire
- Automation – Database and Script based if-then-else logic for error isolation, triage and resolution
- Group Correlation – Different events from different sources can be correlated to a more important event
- Reclassification – Let the event be reclassified in a specified timeframe or XinY logic

Reports and Visualization
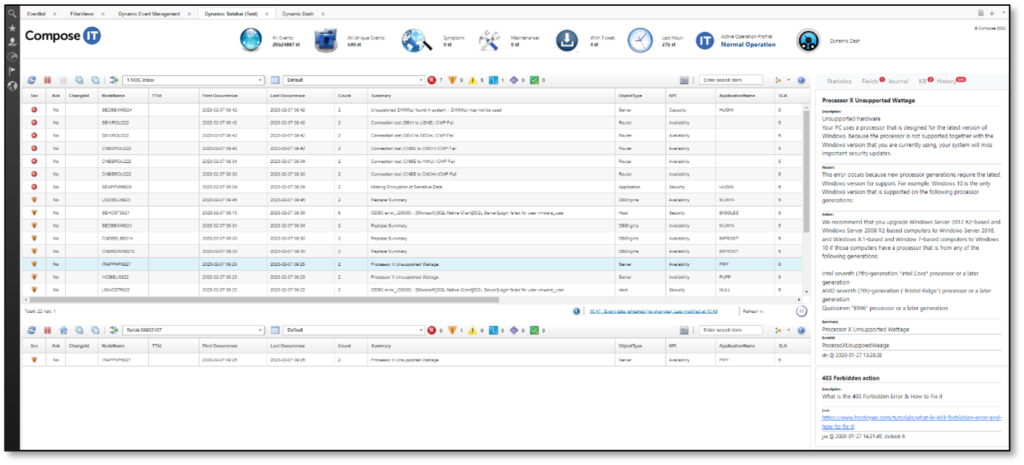
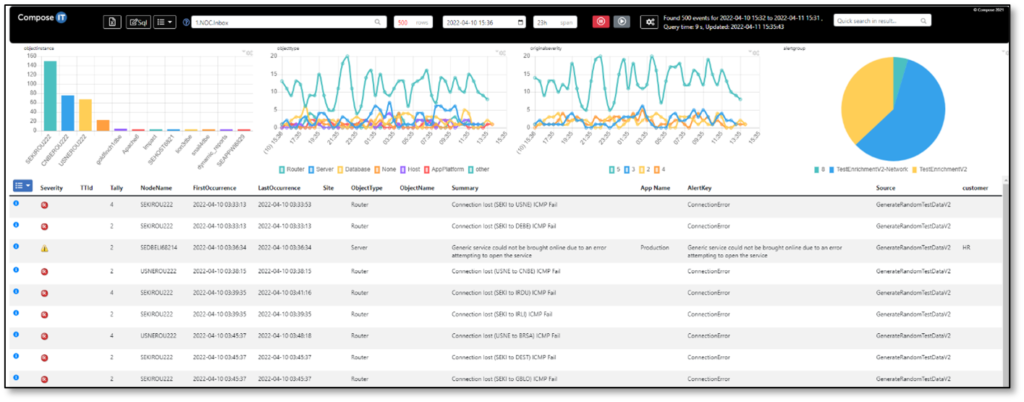
When a good Event Classification has been done the way to informational Reports and Dashboards is short. We have developed a set of reports and dashboards to ensure operational safety, fast response time and good follow-up opportunities.
The reports and dashboards can be adapted for every customer need with a minor adaptation.
- Reports
- Dashboards
- History Search tool
- Dynamic Sidebar

Event Routing
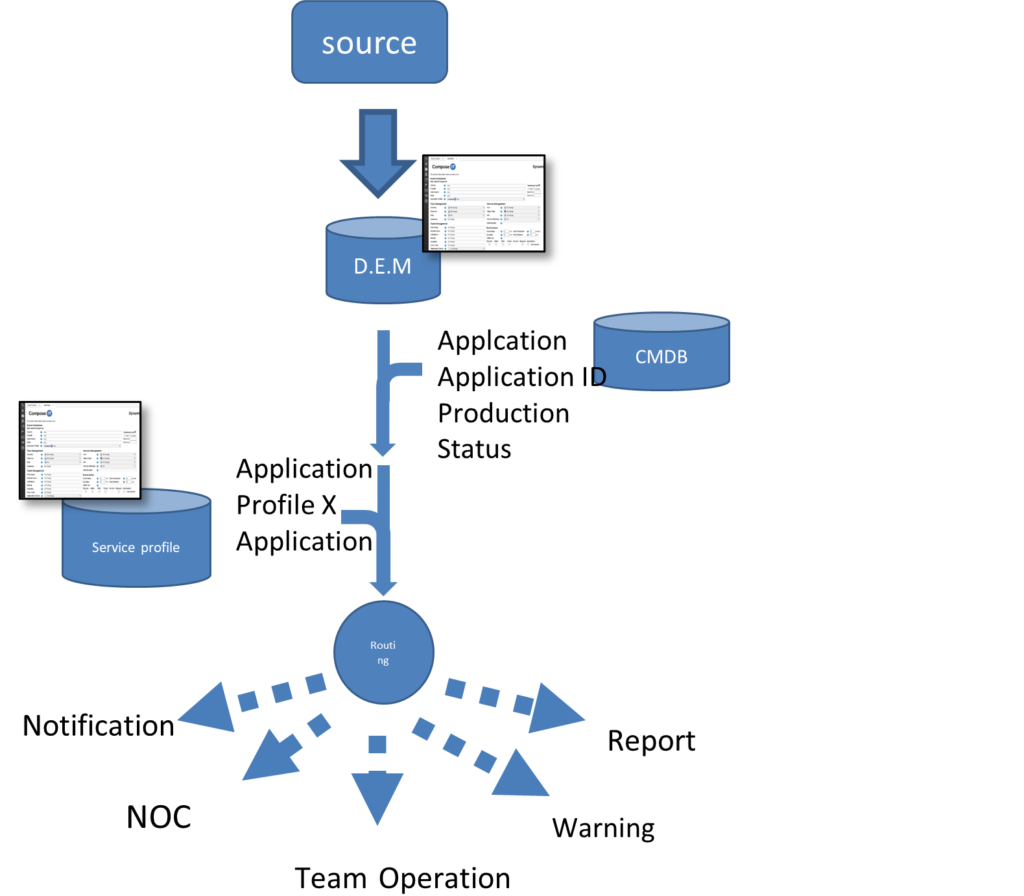
Together with Dynamic Event Management, Event Routing is an add on functionality for customers who are working in a more DevOps like organisation.
Event Routing gives you the possibility to “route” specified events based on your defined rules and Service Profiles to a new DevOps group.
- Team based logic. Based on individual schedules
- Event Action and Routing per team/application
Dynamic Dashboard
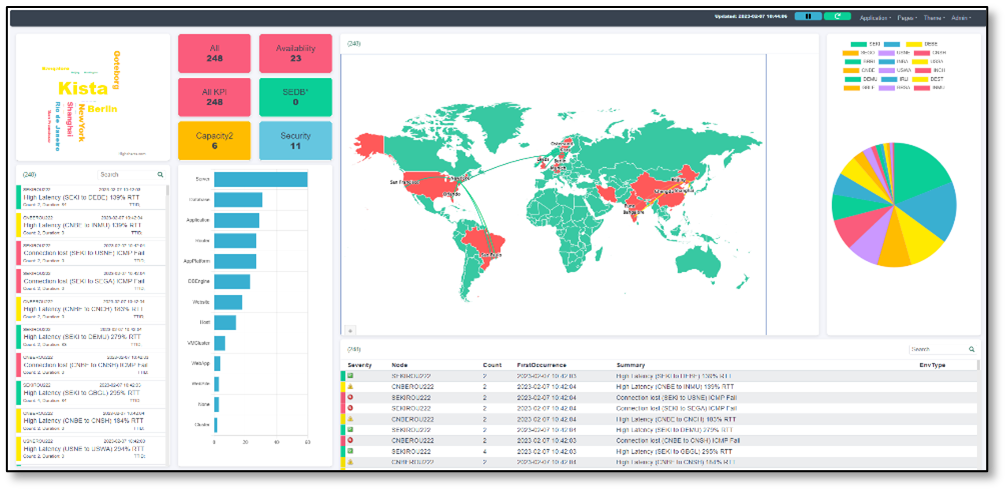
Dynamic Dashboard is developed to further enhance the functionality of Omnibus WebGUI. You can easily create your own Dashboards with the help of drag and drop functionality. Each user or DevOps team can have their own Dashboard, or the same predefined set of Dashboards filled with different data.
Predefined widgets are available to easily build a Dashboard that meets each user’s requirements and needs. An example of this is the GIS based map widget which plots out the alarms on a Google map.
Depending on the needs and area of application, different themes can be used when it comes to coloring the respective Dashboard.
- Drag and drop dashboard
- Predefined and ready to use widgets
- GIS based map visualization
- Page based per application, source and/or customer

Maintenance Scheduler
One of the most important information in Event Management is to be able to enrich every incoming event with correct maintenance and planned change information.
The Maintenance Scheduler is used to handle that challenge and gives you the possibility to register your planned changes and maintenance windows both as reoccurring and temporary in a user-friendly GUI.
The solution also includes the engine to apply the maintenance information to each event and suites in the predefined data model and triggers.
- Easy to use GUI
- Event Matching with single or combinations of keys
- Register in different Time Zones
- Reoccurring or temporary registration


Knowledgebase
“You should not show something for someone that you don’t expect someone to do anything about”. But when you do that, it’s a good idea to let that person know what to do.
The Knowledgebase module in Compose Collection let you structure your knowledgebase articles and connect them to one or more events. Based on the matching you can have more than one article connected to the event (ie. One or more general and one or more specific articles for just that event)
The engine will search for available knowledgebase articles on all incoming events. The articles can then easily be accessed via the Event List in Omnibus just by a single click.
- Easy to use GUI
- Event Matching with single or combinations of keys
- Link to external articles
- Connect general and specific articles to same Event

Self Monitoring 2.0
An Event Management platform also needs to be monitored. The Self Monitoring module is developed to monitor the Netcool platform and other services or functions outside the Netcool system installation in order to secure the operation.
Self Monitoring is designed to test and monitor all the common Netcool troubleshooting commands on a regular basis. This means that the initial troubleshooting time, in the case of system problem or failure, is kept to a minimum.
Hosts can be monitored by the SM2 server or by Agents installed on each server. With Agents installed you got access to the Discovery Agent that’s automatically detect the Netcool applications and other system specific services and automatically starts to monitor them.
Status Overview
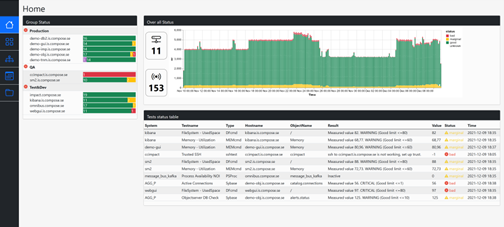
At the Home View you get a quick overview of the status on your platform and systems. Different hosts can be grouped together which makes it possible to have the production environment and the test environment separated from each other.
Every failed test will be visible and easy to find for a more detailed drill-down.
Device Overview
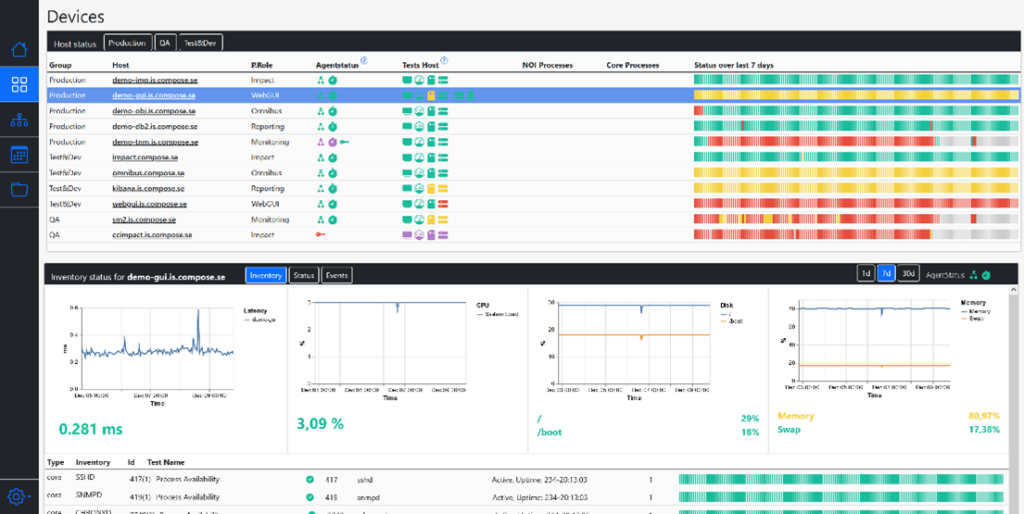
The platform stores measured data which means that you can graph CPU, disk, memory, latency and status on a historically perspective. You can easy detect problems on your platform and drill-down to a more detailed view.
Topology
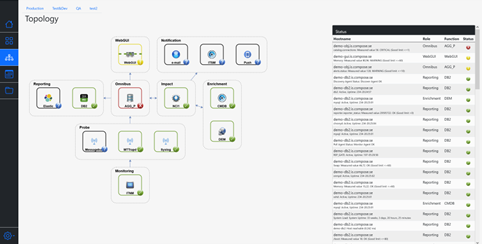
The topology view is configurable through an easy-to-use wizard where you can define the topology and connect each object to selectable tests. The topology will automatically be drawn based on your configuration. The colour on each object will reflect he status and the result on each test is visible in the table to the right.
Status history
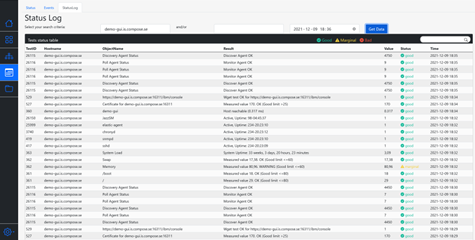
You can search and filter the status history based on your needs. You can see the live status and find the last change on each test.
Wizards
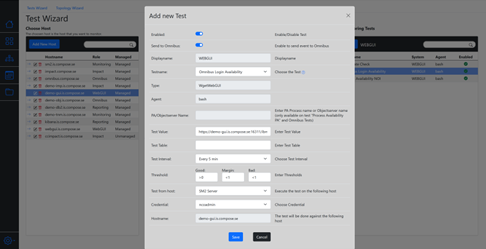
Wizards have been developed for easy configuration of the topology view and the creation of new tests, hosts and objects. Self Monitoring 2.0 have predefined tests for the most common Netcool troubleshooting tasks as well as traditional host monitoring requirements (CPU, disk, memory, availability and system services).
Software Inventory
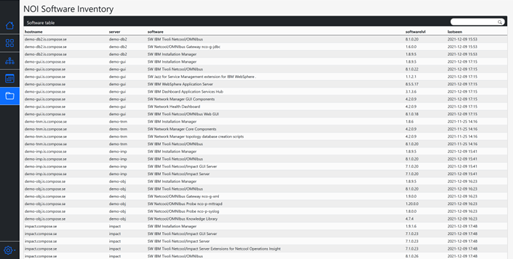
When you are using the Discovery Agent you also get an automatic Netcool inventory. The agent will insert every name and version of your Netcool Application.
Dynamic Admin Portal
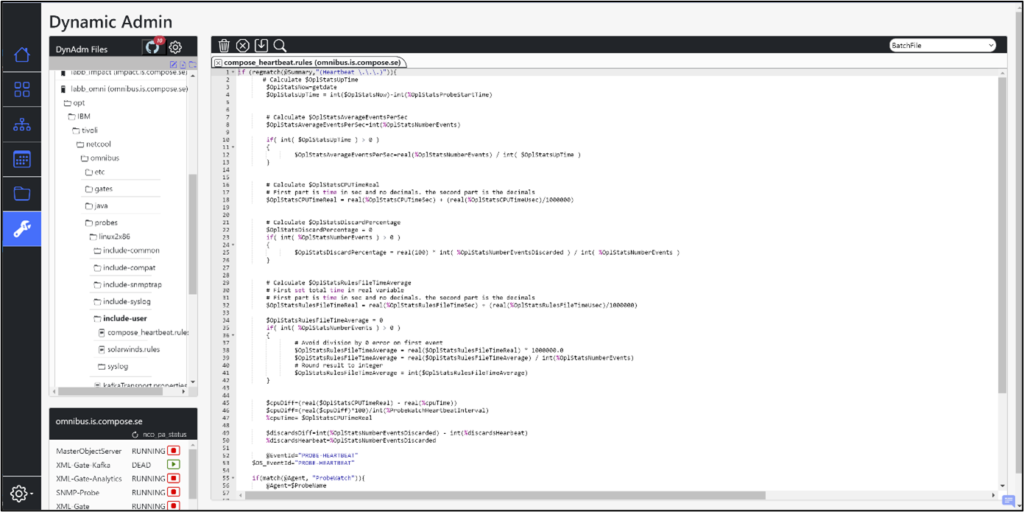
Dynamic Admin Portal (DAP) is a administration interface for Watson AIOps/ Netcool configuration. The configuration in Netcool is distributed on many different places. With DAP all configuration files is centrally managed with automated backup and tracking. This allows for detailed history, audit and allow you to connect Netcool to a code repository like GitHub for version tracking.
Rulefiles, propsfiles, and many other config files can be edited through the web based interface where you easily can see changes and identify who have made the last changes.
DAP will discover your Netcool servers and automatically collect and track the files you use.
Other configuration like Omnibus triggers, Impact policies and filters will be backuped and allow tracking and diff between different servers/environments.
Dynamic Admin Portal is a part of Selfmonitoring 2.0
With Dynamic Admin Portal you can:
- Automatically discover and backup all your Netcool configuration files.
- Backup, Edit and track rules and propsfiles for all your probes.
- Search’n’replace in all you configuration files.
- Start and stop your probes and gateways.
- Backup, Edit and track your nco_pa.conf, omnibus.dat and other config files.
- Be sure all changes are backuped and easily compare differences between versions.
- Create, delete, copy and move config files.
- Add your custom files to DPA controll.
- Connect your file repository to GIT for even more control and security.
- Compare files between versions or environments.
… in a central web GUI.

Virtual Operator
Virtual Operator (VO) is an automation module where you can create complex scenarios to manage events, correlation, notification and escalation. The Virtual Operator can be used to perform analysis and triage before taking decision on action.
Virtual Operator can work before your NOC or in cooperation with the NOC to offload or replace human intervention in the Event process.
Just as your operators VO continuously watches the Inbox for specific events or combinations of events. When a scenario is matched the VO can take actions and verify the result to make decisions for further actions or send feedback to the event or journal.
As administrator this is all configured by a no-code interface with reusable building blocks.
Some examples what VO can perform:
- Identify and group events based on custom conditions. For example, power outages.
- Evaluate combinations of events.
- Create incidents for complex combinations of events.
- Run triage and add information to even, ticket or journal.
- Notify by any channel (mail, chat, phone, ticket)
- Find other related events to a node, service, or location.
- Ack events, move events, close events, escalate events.
- Create new event and set as root-cause or group


