Compose Collection
Simply put, Compose Collection is the name of our collective capital of invested time and knowledge. Over the years, we have accumulated over 600,000 hours of experience and are constantly looking for smarter ways to get faster and better value in our customers’ IT environments.
2022 comes with a lot of news that is described below together with the respective module.
General description
The Compose Collection is part of the Compose Operation Platform (COP) and is a solid collection of ready-made scripts, advanced automations, reports and dashboards that Compose IT has developed into a useful toolbox.
With our experience of working closely with our customers, we have learned what is needed to quickly get started with the solution and to get the most out of both technology and organization in a cost-effective way.
The Compose Collection portfolio consists of seven different modules where each module has its specific feature and function. The various modules, which can be used together or individually, are continuously evaluated and updated with functions that our customers have requested or that we ourselves have concluded create added value. As a Compose IT customer, you naturally get access to these updates as soon as they are generally available.
By using the various modules in the Compose Collection, you quickly and easily get a turnkey solution that is useful and ready to immediately create value and ease of use in your IT Operations.
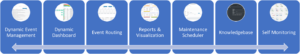
Compose Collection modules
Below follows a description, including example images, of the various modules and their respective areas of use. For more information, or a live demo, please contact us and we will tell you more.
The seven different modules in the Compose Collection are:
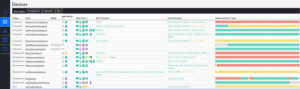
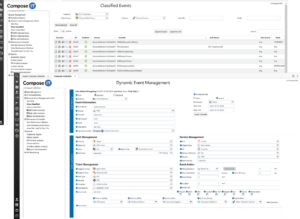
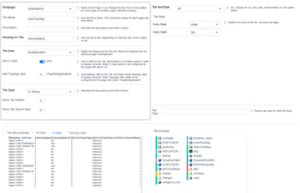
Description – Dynamic Event Management
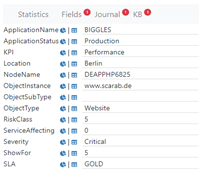
We have developed a concept to be able to dynamically classify incoming events so that they are automatically processed by the system as desired. Everything is done via a user-friendly GUI and you can easily let the system owner or administrator into the interface. In other words, the person who knows their environment and its alarms best.
In this way, we ensure that the right alarm gets the right priority and is shown to the right person. The alarm is enriched with the necessary information for the case to be placed in the right group and within the right area in the case management system. The correct KPI is applied to the alarm so that the impact can be calculated in an efficient and simple way.
Do you want a certain type of classification to apply generally, but another if e.g. the same alarm comes from a certain node and a certain time of day or if you want the classification to apply if e.g. ten identical alarms are received within a minute, then there is no problem. Everything is configurable in the interface.
Do you want to perform automatic actions such as start one or more scripts for automatic control or action, create a matter, send an email, SMS or a push message at the same time as the alarm comes in or after a defined time, that is also possible. If you even want to start a siren or a flashing light, that’s also fine.
The solution is self-learning and automatically adds new alarms for classification. This means that you get a clear overview of what is unclassified and the search in historical databases for incoming events is no longer necessary.
The interface is accessed through the Netcool Omnibus WebGUI where roles and rights control who sees what.
Description – Dynamic Dashboard
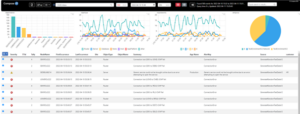
You can easily create your own Dashboards using “drag and drop” functionality. Each user or DevOps team can have their own Dashboard or the same predefined set of Dashboards populated with different data.
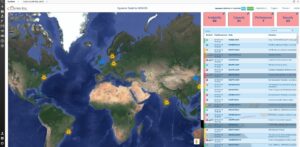
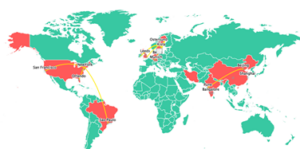
Predefined widgets are also available to easily build a Dashboard that meets the respective user’s requirements and needs. An example of this is the GIS-based map widget that plots the alarms on a Google Map.
Depending on the need and area of use, different themes can be used when it comes to the coloring of the respective Dashboard.
News 2022
- Dynamic Dash has now reached version 4.0, a lot has happened behind the scenes but the biggest change is that the administration interface has been redesigned from the ground up
- You have access to a ‘Data view’ to see which data you have access to while configuring your dashboard
- The preview view shows you what the finished result will look like while you adjust your dashboard. This greatly simplifies your work
- ‘Page’ export and import now makes it possible to move entire dashboards between test and production with a few simple clicks!
- You can now divide your dashboards into different organizations so that everyone doesn’t have to see everything. This simplifies navigation and increases security
- In addition, several ’tile-types’ have received an update
- Chart has received horizontal bars and ‘stacked-bars’
You can also choose a color for all bars, which creates a cleaner impression - You can also visualize links and their status in the maps
- Base-tile has, together with CI-status and top-N, received the ‘edge’ theme
- Last but not least, sorting has now become local and can be controlled per tile
- Chart has received horizontal bars and ‘stacked-bars’
- We have also created two new themes, ‘Cards’ and ‘Grey’ which give a face lift to the whole Dynamic Dash
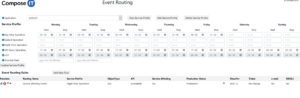
Description – Event Routing
Event Routing är utvecklad för att stötta organisationer som har valt att arbeta mer Team- eller DevOps baserat. Event Routing är ett komplement till modulen Dynamic Event Management, vilket innebär att den fördefinierade regeln i Dynamic Event Management gäller tills dess något annat är meddelat.
Description – Reports and Visualization
The Reports and Visualization module is designed and developed together with our customers to ensure operational reliability, fast reaction time and good follow-up possibilities.
By classifying your Events with the help of Dynamic Event Management, you simultaneously create an incredibly good basis for reporting and visualization, both in real time and from a historical perspective.
With the help of this, we have developed a number of customized Dashboards and Reports to meet the demands that our customers have on their IT Operation.
News 2022
Reports & Visualization has received the addition of several new parts and now consists of:
- Omnibus Statistics v 4.0
This module creates statistics of the events in Omnibus. News is that you get statistics per filter which are then used in Filter View, Side Bar and Dynamic Dash - Group Stats v 1.0
This module creates statistics for your group alarms. This allows you to easily get an overview of ongoing events that involve many events - Filter View 1.0
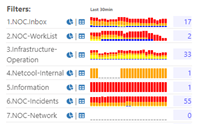
R&V collects the filters created in Omnibus so that these can be used in everything from Omnibus Statistics to SideBar and History Tool. Even the Filter View itself can show how the events are distributed between your filters and gives you the opportunity to directly open the right alarm list or historical search
Side Bar 2.0
By always having an overview of the filters that matter, you get unprecedented control over what’s going on in Watson AIOps and where your attention is needed
- Dynamic Sidebar v1.0
This is something that many of our customers have variants of, but now we have finally developed a generic ‘side bar’ where you have direct access to important information from the alarms, from the journal or from your knowledge database. This is also flexible so that you can tie in any information you want.
- History Tool v 5.0
V5.0 now has a more flexible search engine. You can choose to use the filters found in Omnibus, a Google-like search on e.g. node name and location or, as usual, a detailed SQL search. Of course, support for Elastic and exports remains.
Description – Maintenance Scheduler
One of the most important tasks in Event Management is to be able to enrich each incoming Event with the correct status regarding work in progress or “Change”.
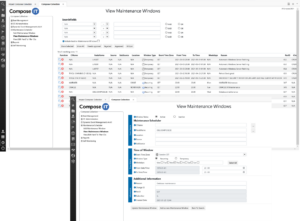
Maintenance Scheduler is used to address that challenge and allows you to record your planned changes and maintenance windows as both recurring or temporary in a user-friendly GUI. The module also contains the engine for applying the information to each event and thus fits into the predefined data model and its triggers.
Matching of the Events can be done in a variety of ways and consideration is given to the fact that the events may come from different time zones.
Description – Knowledge Base
You should never show anything to anyone unless you expect someone to do something about it.
But when you do, it’s a good idea to let the person know what to do.
With the Knowledge Base module in the Compose Collection, you can structure your knowledge-based articles and connect them to one or more events.
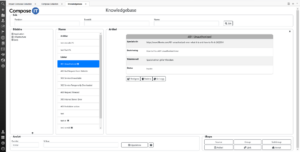
Based on the match, you may have more than one article associated with an event, i.e. one or more general and one or more specific articles for that particular event.
The Knowledge Base searches for available articles on incoming alarms and the articles can then be easily accessed via the Event List in Omnibus with a single click.
Description – Self Monitoring
An Event Management platform must also be monitored.
The Self Monitoring module is developed to monitor the Netcool platform and other services or functions in surrounding components to ensure the operational operation.
Self Monitoring is designed to test and monitor the most important functions of your Netcool system where also some troubleshooting commands are executed regularly. This means that the initial troubleshooting time, in the event of a system problem or error, is kept to a minimum.
Self Monitoring also monitors the following functions:
- Server availability
- Process availability
- Database connections
- Web service connections
- Active Netcool connections
- Cluster status
- Event flows
- Disk filling
- All SSL certificates in the solution
- Different types of Event controls
- In addition, it is easy to define new tests
News 2022
Self Monitoring has reached version 2.0 and is now called “SM2”.
It is a completely reworked version from the ground up. It is significantly more easily administered and flexible.
Some of the biggest news are:
- Agents
You can monitor the servers via SSH or via agents. It’s up to you and very flexible - Discovery
SM2 scans your servers and identifies which components are located where and creates tests for these automatically - History
You can now see what happened in your environment yesterday or last week - Inventory
Which versions are running on your system, get a list of all NOI products and their versions - Grouping
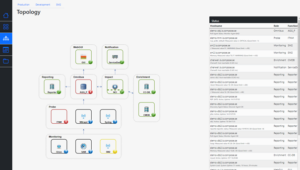
If you have production, test and QA environments, no problem, now you can see the status of each system separately - Dynamic Topology
Create your topology in a few minutes and choose whether Servers or Components should be the focus