
Compose Collection 2021
Compose Collection 2021
Simply put, Compose Collection is the name of our collective capital of invested time and knowledge. Over the years, we have accumulated over 600,000 hours of experience and are constantly looking for smarter ways to get faster and better value in our customers’ IT environments. Below is a description of all included components with the latest updates for each module.
General description
Compose Collection is part of the Compose Operation Platform (COP) and is a solid collection of ready-made scripts, advanced automations, reports and dashboards that Compose IT has developed into a very useful toolbox.
With our long experience of working closely with our customers, we have learned what is needed to quickly get started with the solution and get the most out of both technology and organization in a cost-effective way.
The Compose Collection portfolio consists of seven different modules where each module has its specific feature and function. The various modules, which can be used together or individually, are continuously evaluated and updated with functions that our customers have requested or that we ourselves have concluded create added value. As a Compose IT customer, you naturally get access to these updates as soon as they are generally available.
By using the various modules in the Compose Collection, you quickly and easily get a turnkey solution that is useful and ready to immediately create value and ease of use in your IT Operations.
Compose Collection modules
Below follows a description, including example images, of the various modules and their respective areas of use. For more information, or perhaps a live demo, please contact us and we will tell you more.
The seven different modules in the Compose Collection are:

Description – Dynamic Event Management
You don’t have to worry about complicated rule files and advanced calculation models. We have developed a concept to dynamically classify incoming events so that they are automatically processed by the system as desired. Everything is done via a user-friendly GUI and you can easily let the system owner or administrator into the interface. In other words, the person who knows their environment and its alarms best.
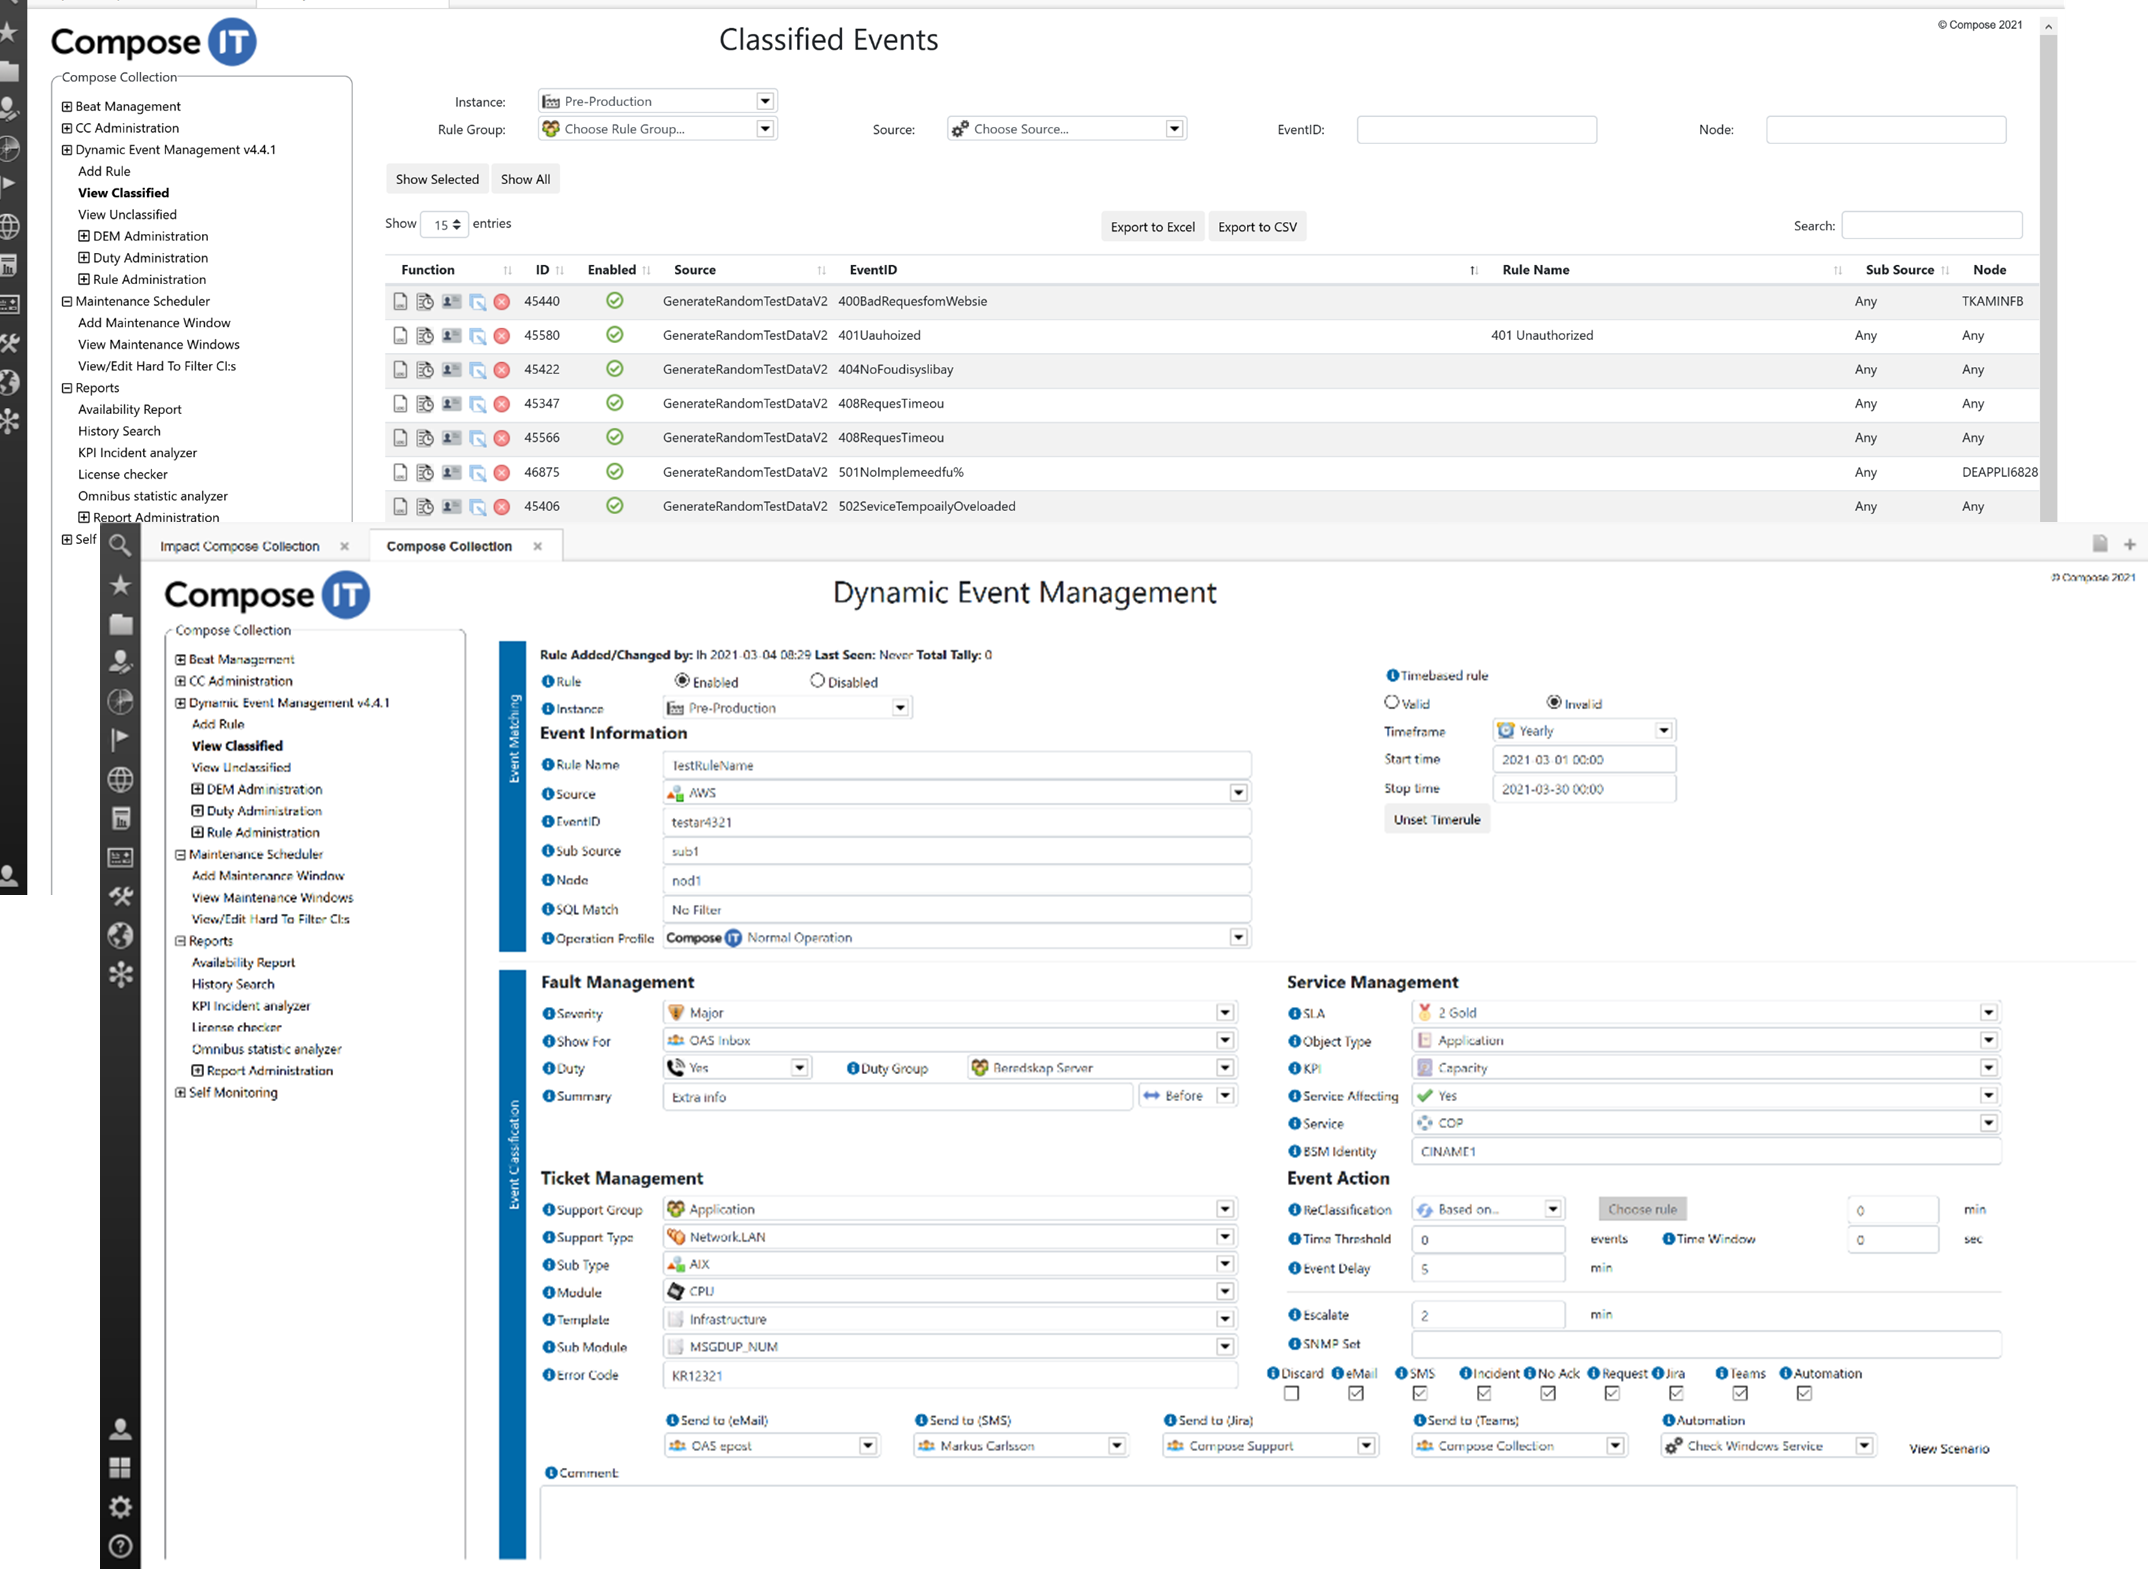
In this way, we ensure that the right alarm gets the right priority and is shown to the right person. The alarm is enriched with the necessary information for the case to be placed in the right group and within the right area in the case management system. The correct KPI is applied to the alarm so that the impact can be calculated in an efficient and simple way.
Do you want a certain type of classification to apply generally, but another if e.g. the same alarm comes from a certain node and a certain time of day or if you want the classification to apply if e.g. ten identical alarms are received within a minute, then there is no problem. Everything is configurable in the interface.
Do you want to perform automatic actions such as start one or more scripts for automatic control or action, create a matter, send an email, SMS or a push message at the same time as the alarm comes in or after a defined time, that is also possible. If you even want to start a siren or a flashing light, that’s also fine.
The solution is self-learning and automatically adds new alarms for classification. This means that you get a clear overview of what is unclassified and the search in historical databases for incoming events is no longer necessary.
The interface is accessible via the Netcool Omnibus WebGUI where roles and rights control who sees what.
Description – Dynamic Dashboard
The Dynamic Dashboard module is developed to further strengthen the functionality of the Omnibus WebGUI. You can easily create your own Dashboards using ”drag and drop” functionality. Each user or DevOps team can have their own Dashboard or the same predefined set of Dashboards populated with different data.
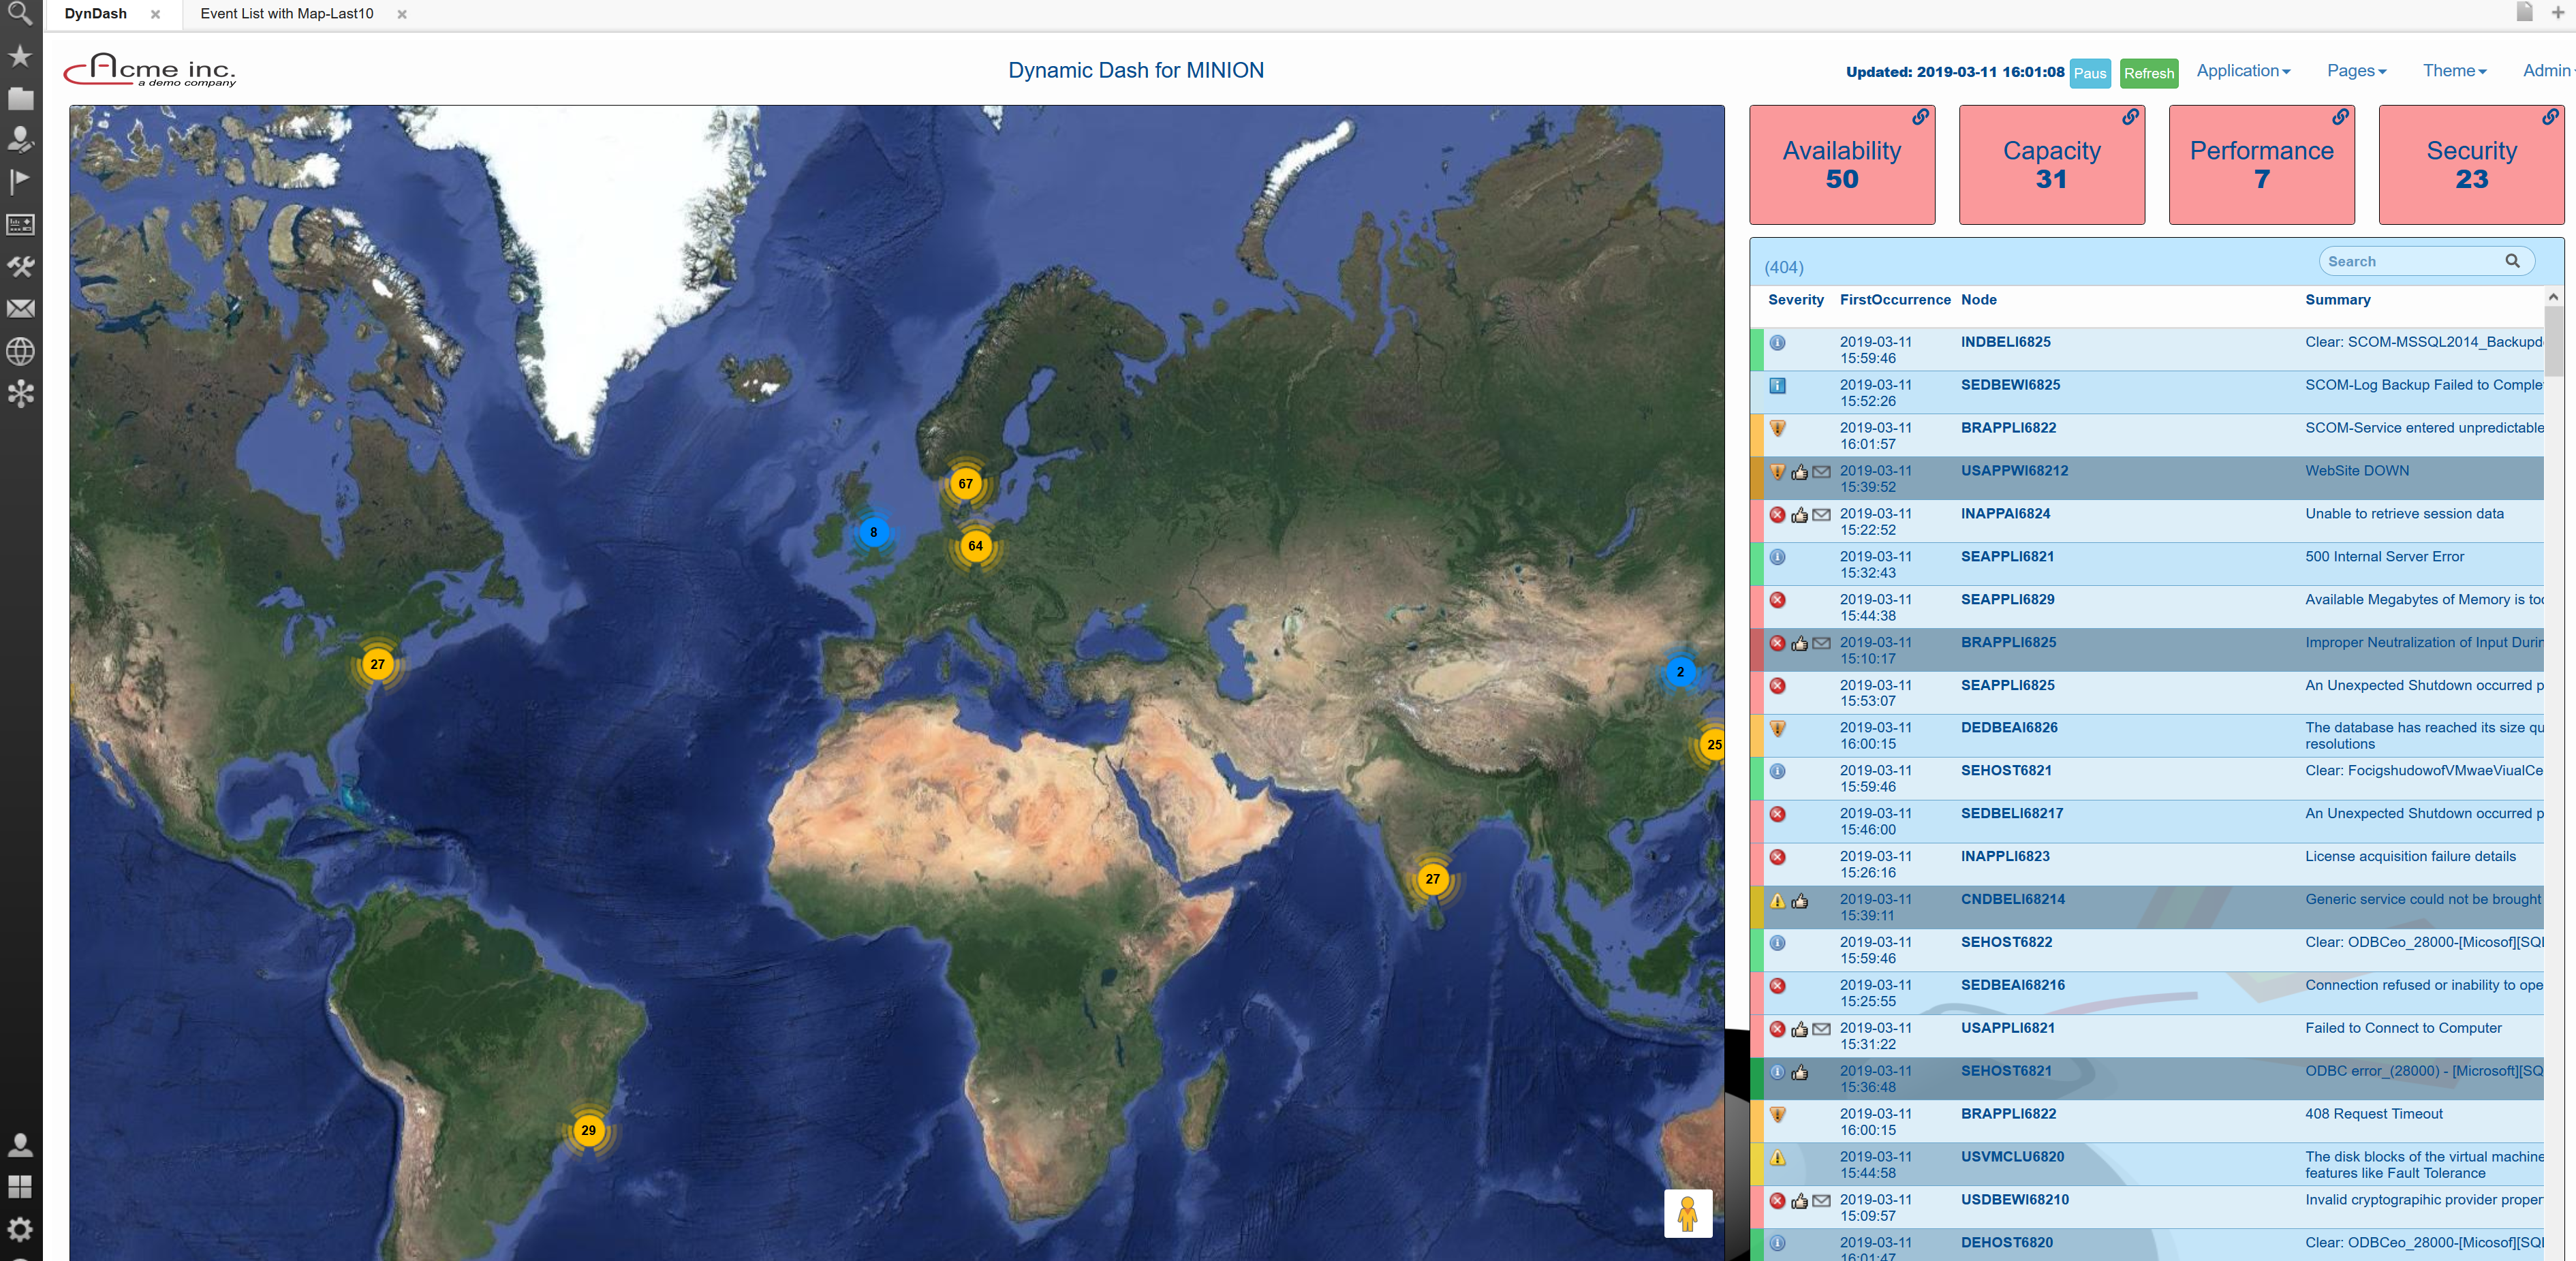
Predefined widgets are also available to easily build a Dashboard that meets each user’s requirements and needs. An example of this is the GIS-based map widget that plots the alarms on a Google Map.
Depending on the need and area of use, different themes can be used when it comes to the coloring of the respective Dashboard.
Description – Event Routing
Event Routing is developed to support organizations that have chosen to work more Team or DevOps based. Event Routing is a complement to the Dynamic Event Management module, which means that the predefined rule in Dynamic Event Management applies until otherwise notified.
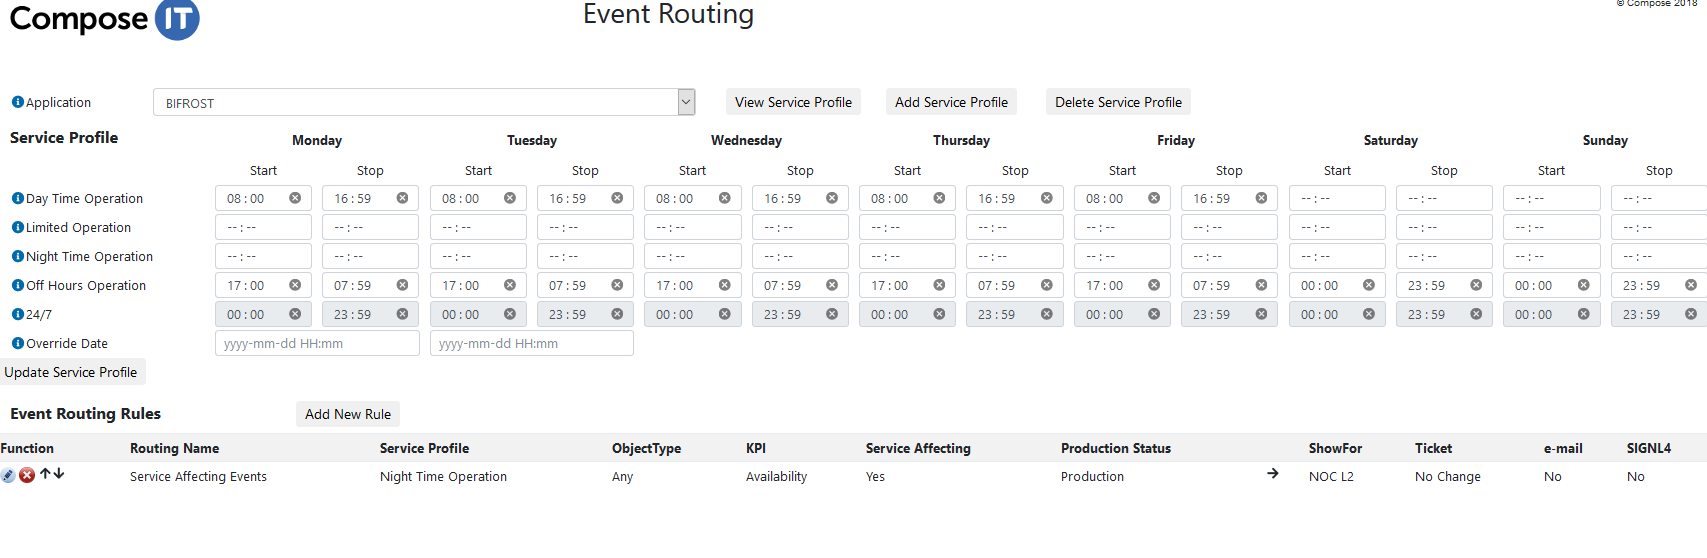
With the help of Event Routing, each Team can set up their different Service Profiles themselves and ensure that the right alarm reaches the right recipient at the right time.
You decide for yourself when the Team is staffed and which times apply. During unmanned hours, you can let the alarms and possible incidents go to the central function of IT Operations.
Description – Reports and Visualization
The Reports and Visualization module is designed and developed together with our customers to ensure operational reliability, fast reaction time and good follow-up possibilities.
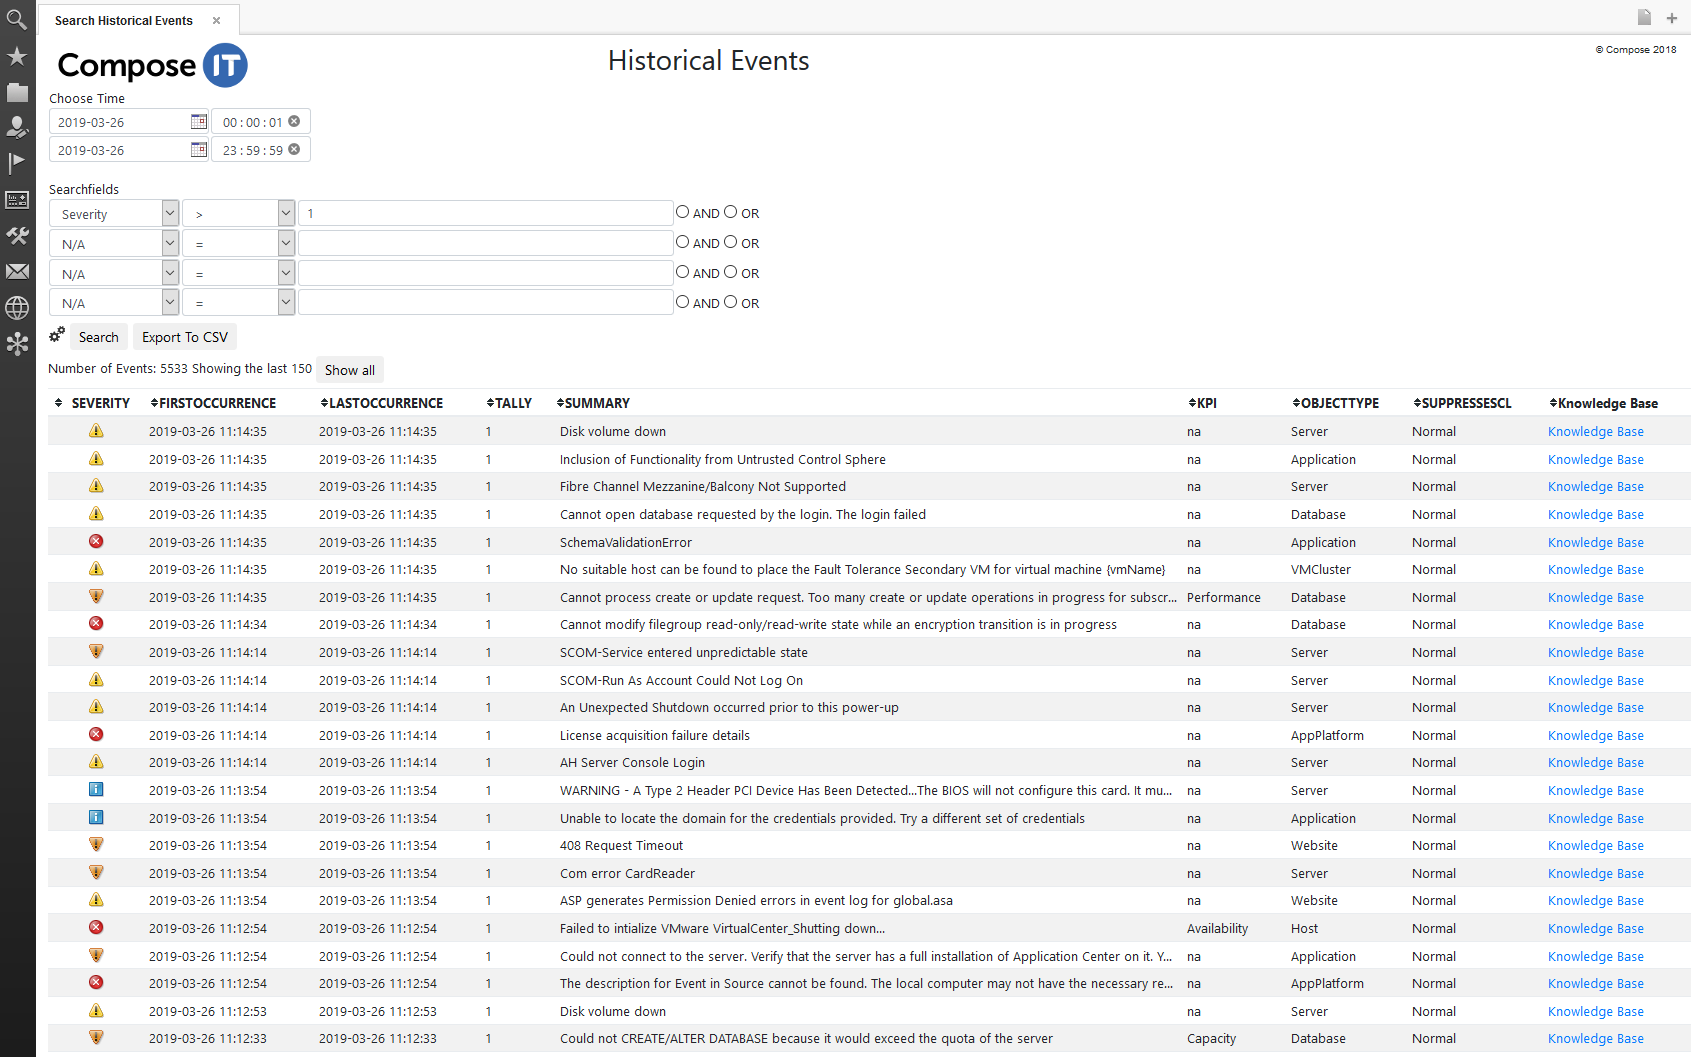
By classifying your Events with the help of Dynamic Event Management, you simultaneously create an incredibly good basis for reporting and visualization, both in real time and from a historical perspective.
With the help of this, we have developed a number of customized Dashboards and Reports to meet the demands that our customers have on their IT Operation.
Description – Maintenance Scheduler
One of the most important tasks in Event Management is to be able to enrich each incoming Event with the correct status regarding work in progress or ”Change”.

Maintenance Scheduler is used to address that challenge and allows you to record your scheduled changes and maintenance windows as both recurring or temporary in a user-friendly GUI. The module also contains the engine for applying the information to each event and thus fits into the predefined data model and its triggers.
Matching of the Events can be done in a variety of ways and consideration is given to the fact that the events may come from different time zones.
Description – Knowledge Base
You should never show anything to anyone unless you expect someone to do something about it.
But when you do, it’s a good idea to let the person know what to do.
With the Knowledge Base module in the Compose Collection, you can structure your knowledge-based articles and connect them to one or more events.
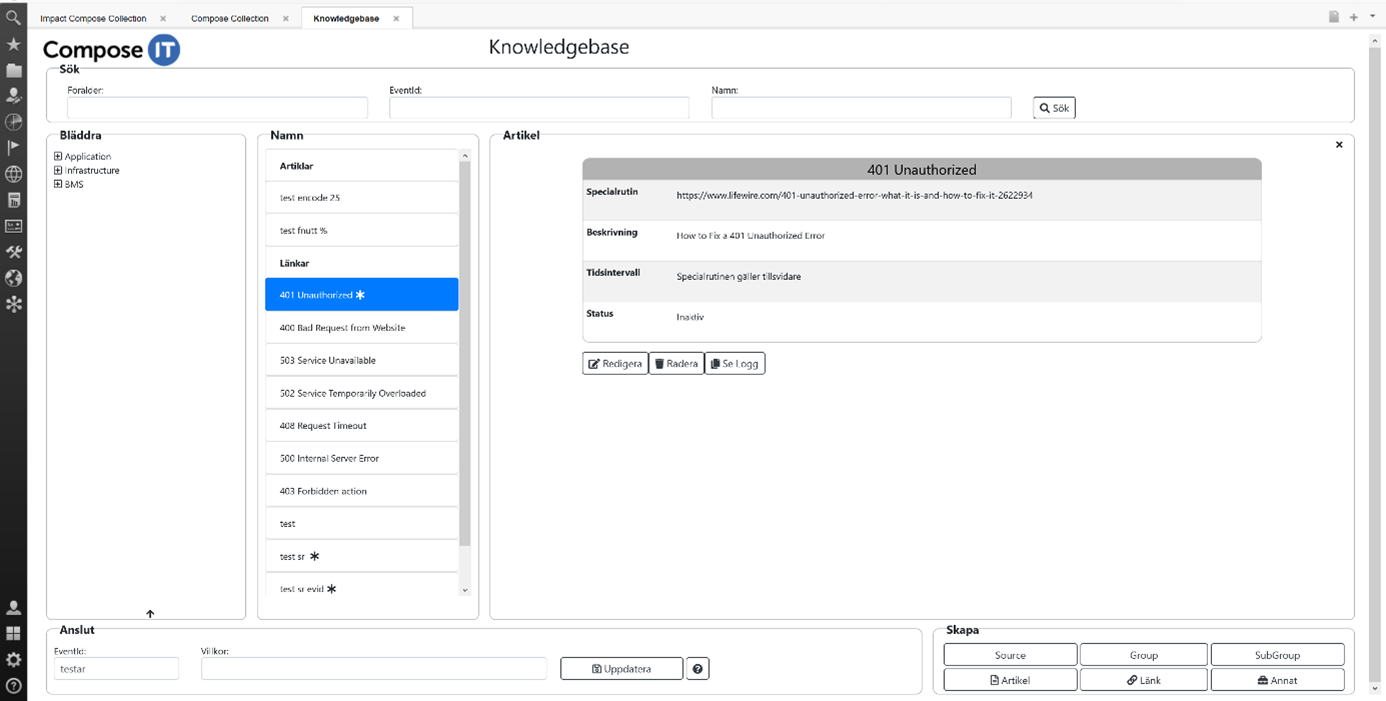
Based on the match, you may have more than one article associated with an event, i.e. one or more general and one or more specific articles for that particular event.
The Knowledge Base searches for available articles on incoming alarms and the articles can then be easily accessed via the Event List in Omnibus with a single click.
Description – Self Monitoring
An Event Management platform must also be monitored.
The Self Monitoring module is developed to monitor the Netcool platform and other services or functions in surrounding components to ensure the operational operation.
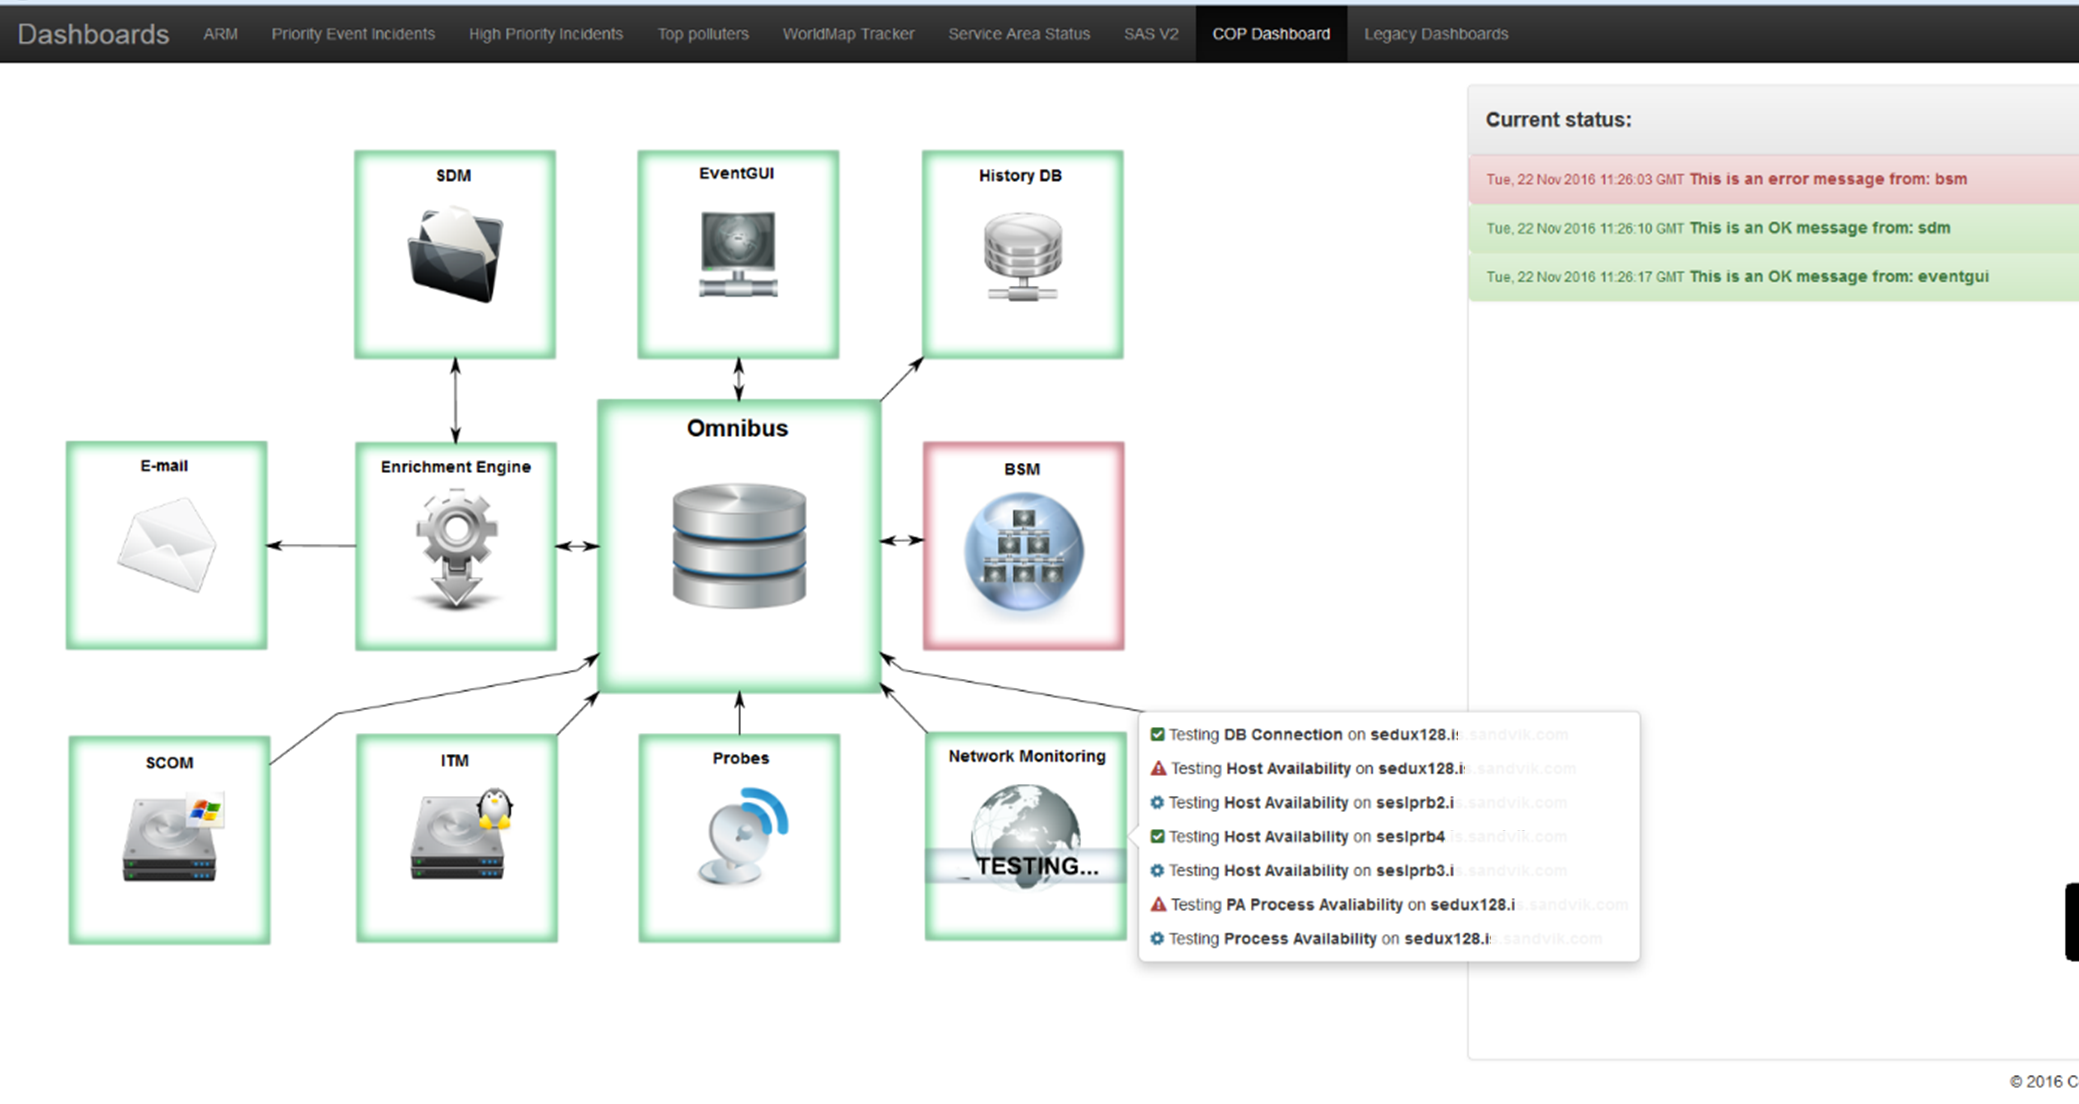
Self Monitoring is designed to test and monitor the most important functions of your Netcool system where also some troubleshooting commands are executed regularly. This means that the initial troubleshooting time, in the event of a system problem or error, is kept to a minimum.
Self Monitoring also monitors the following functions:
- Server availability
- Process availability
- Database connections
- Web service connections
- Active Netcool connections
- Cluster status
- Event flows
- Disk filling
- All SSL certificates in the solution
- Different types of Event controls
- In addition, it is easy to define new tests


